
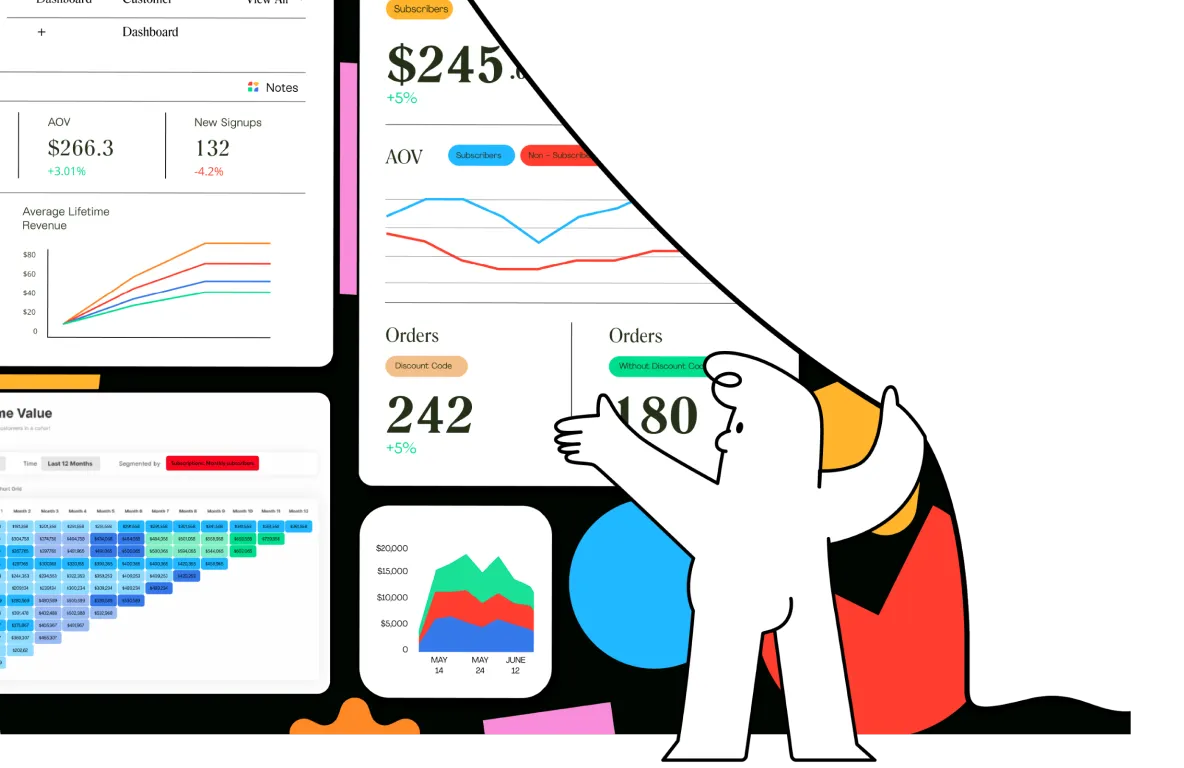
Cohort analysis helps online stores understand how customer behavior changes over time. Instead of looking only at total sales or monthly revenue, you group customers by a shared characteristic—such as their first purchase month—and compare their repeat purchases, retention, and spending.
By analyzing customer cohorts, e-commerce businesses can discover whether new customers return, which acquisition campaigns attract valuable buyers, and whether retention is improving. This guide explains how to perform cohort analysis, interpret the results, and turn the findings into better marketing and customer experience decisions.
What Is Cohort Analysis in E-Commerce?
Cohort analysis is a method of grouping customers who share a common starting point or characteristic and observing how they behave over a defined period. In e-commerce, a cohort often consists of customers who made their first purchase during the same week or month.
For example, you could group all first-time customers acquired in January and track how many of them purchase again in February, March, and April. You could then compare that group with customers whose first purchase occurred in February.
This approach adds context to ordinary sales reports. Total revenue might increase because your store acquired more customers, even if fewer customers are returning. Cohort analysis helps separate growth from changes in customer behavior.
Common E-Commerce Cohort Types
| Cohort Type | How It Is Defined | What It Helps Explain |
|---|---|---|
| Acquisition cohort | Customers acquired during the same period. | How retention changes across customer acquisition dates. |
| First-purchase cohort | Customers making their first-ever purchase in the same period. | Repeat purchase behavior after the initial order. |
| Channel cohort | Customers grouped by acquisition channel or campaign. | Which sources attract customers who return and spend more. |
| Product cohort | Customers whose first purchase includes a specific product or category. | Whether certain products lead to stronger repeat purchasing. |
| Geographic cohort | Customers grouped by market or region. | Differences in repeat purchasing, shipping experience, or demand. |
| Subscription cohort | Subscribers grouped by start date or plan. | Renewals, churn, and recurring revenue behavior. |
Why Cohort Analysis Matters for Online Stores
Acquiring customers is only one part of e-commerce growth. The long-term value of a customer depends partly on whether they return, how frequently they order, and how much they spend over time.
Cohort analysis can help you:
- Measure whether first-time buyers become repeat customers.
- Compare retention before and after a marketing or website change.
- Understand whether paid campaigns generate lasting customer value.
- Identify products that encourage repeat orders.
- Evaluate loyalty programs and post-purchase email campaigns.
- Improve customer lifetime value (CLV) estimates.
- Recognize potential customer experience issues before they affect more buyers.
It is particularly useful for stores that want to grow profitably rather than rely exclusively on discounts and continuous customer acquisition.
1. Choose the Right Cohort Definition
Before creating a cohort report, decide what group you want to study. Your cohort definition should match the business question you want to answer.
Example: First-Time Purchase Month
Suppose you want to know whether customers acquired during a holiday promotion become repeat buyers. Create a cohort containing customers whose first-ever purchase occurred in November. Track their repeat purchases in the following months and compare them with customers acquired in other months.
Use the customer’s first-ever order, not simply the first order visible in a limited report. If older order history is missing, some existing customers may be incorrectly classified as new customers.
Choose a Useful Time Interval
- Daily cohorts: Useful for high-volume stores and short purchase cycles.
- Weekly cohorts: Helpful for campaign analysis and stores with frequent purchases.
- Monthly cohorts: Useful for most stores reviewing longer-term repeat purchasing.
- Quarterly cohorts: Can work for products with long replacement cycles or infrequent purchases.
Choose an interval that reflects how often customers realistically need to buy again. A monthly retention report may be less informative for a product that customers purchase only once or twice per year.
2. Collect and Prepare Your E-Commerce Data
Reliable cohort analysis depends on accurate customer and transaction data. At a minimum, you generally need a stable customer identifier, an order date, an order identifier, and the relevant purchase value.
Depending on the analysis, you may also need acquisition source, product category, discount amount, refund status, shipping market, and variable costs.
Use consistent customer identifiers across devices and sessions where you have a lawful, reliable way to do so. Deduplicate orders, handle refunds consistently, and distinguish first-time customers from returning buyers. Anonymous users and consent-related measurement gaps can limit what you can observe.
Common Data Sources
- GA4: Useful for behavior and cohort exploration when the relevant events and identifiers are configured correctly.
- Shopify or another e-commerce platform: Useful for orders, customer history, products, and refunds.
- Customer data platform (CDP) or CRM: Useful for combining customer interactions from supported sources.
- Data warehouse: Useful for more flexible SQL analysis across large datasets and multiple systems.
- Spreadsheets: Suitable for small datasets and simple cohort calculations.
Do not assume every platform defines a customer, session, purchase, or revenue identically. Document the source of each metric and use the same definitions when comparing cohorts.
3. Decide Which Cohort Metrics to Measure
Retention is one of the best-known cohort metrics, but it is not the only one. The right metrics depend on whether you want to understand customer loyalty, revenue growth, marketing efficiency, or profitability.
| Metric | Basic Formula | What It Reveals |
|---|---|---|
| Customer retention rate | Customers returning in period ÷ original cohort size × 100 | How many customers remain active under your definition. |
| Repeat purchase rate | Customers with 2+ orders ÷ customers in cohort × 100 | How many customers buy more than once. |
| Orders per customer | Orders in cohort ÷ cohort customers | How frequently the group purchases. |
| Cumulative revenue per customer | Cumulative cohort revenue ÷ original cohort size | How much revenue each originally acquired customer generates on average. |
| Average order value | Revenue ÷ number of orders | Whether order sizes change over time. |
| Customer lifetime value | Depends on the chosen CLV definition and time horizon. | The economic value of customers over their relationship with the business. |
| Contribution per customer | Cohort contribution ÷ original cohort size | How much value remains after included variable costs. |
Always state the denominator and time period. For example, a retention rate can mean customers who purchased during a specific month, customers who purchased at least once after acquisition, or customers active at the end of a period. These are different measurements.
4. How to Perform Cohort Analysis in GA4
Google Analytics 4 provides cohort exploration tools that can help you analyze groups of users over time. Exact report options and dimensions may vary with the property configuration and available data.
- Open Explore in GA4.
Start a new exploration and select the cohort exploration technique when it is available for your analysis. - Define the inclusion criteria.
Choose the event or user condition that determines when a user enters the cohort. For purchase retention, decide whether the starting event should be a first purchase or another acquisition event. - Choose the return condition.
Define what counts as a return, such as a subsequent purchase or another meaningful event. A visit alone is not the same as a repeat purchase. - Select the cohort granularity.
Choose daily, weekly, or monthly intervals based on your sales cycle and reporting needs. - Apply relevant segments.
Where appropriate, compare acquisition channels, devices, markets, or other supported dimensions. - Interpret the results.
Look for differences between cohorts and patterns across elapsed periods, while checking data completeness and tracking changes.
GA4 cohort reports analyze users according to configured conditions; they do not automatically replace a transaction-level customer retention analysis. If you need reliable first-order identification, repeat-purchase rates, refunds, or profit by cohort, your e-commerce platform or warehouse may be the better source.
5. Build a Cohort Retention Table
A cohort retention table typically places acquisition cohorts in rows and elapsed time since acquisition in columns. Each cell shows the percentage of the original cohort that returned during—or by—the corresponding period, depending on the chosen definition.
Here is a simplified example of periodic purchase retention:
| First Purchase Cohort | Month 0 | Month 1 | Month 2 | Month 3 |
|---|---|---|---|---|
| January | 100% | 28% | 22% | 18% |
| February | 100% | 32% | 25% | — |
| March | 100% | 26% | — | — |
| April | 100% | — | — | — |
Illustrative figures only. Month 0 represents the acquisition period. Dashes indicate periods that have not yet elapsed, rather than zero retention.
In this example, the February cohort has a higher Month 1 retention rate than the January cohort. That may be a promising signal, but it does not establish why the difference occurred. Product mix, discounts, seasonality, channel composition, and sample size may all influence the result.
6. Analyze Revenue by Cohort
Retention tells you whether customers return, but revenue analysis reveals how much they spend. Two cohorts can have identical retention rates and very different commercial value if one group places larger orders or purchases more frequently.
Common revenue metrics include:
- Revenue per acquired customer: Total cohort revenue divided by the original number of customers in the cohort.
- Cumulative revenue per customer: Revenue accumulated from acquisition through a selected elapsed period, divided by the original cohort size.
- Average order value: Revenue divided by the number of orders during the relevant period.
- Contribution per acquired customer: Cohort contribution after defined variable costs, divided by the original cohort size.
For instance, a cohort that generates $20 in cumulative revenue per acquired customer after three months may appear stronger than one generating $15. However, the comparison is meaningful only if both cohorts have had the same three-month observation window and revenue is calculated consistently.
Customers acquired last month have had less time to make repeat purchases than customers acquired six months ago. Compare the same elapsed periods, such as Month 1 against Month 1 and Month 3 against Month 3.
7. Use Cohort Analysis to Evaluate Marketing Channels
Customer acquisition reports often focus on clicks, conversion rates, and initial acquisition cost. Cohort analysis adds a longer-term perspective by showing what happens after the first order.
For each acquisition channel or campaign, consider comparing:
- First-purchase conversion rate.
- Repeat purchase rate after 30, 60, or 90 days, where appropriate.
- Cumulative revenue per acquired customer.
- Contribution margin after discounts, returns, and variable costs.
- Customer acquisition cost (CAC) alongside later customer value.
A paid campaign may generate many first orders but few repeat purchases. Another campaign may produce fewer customers who return more often. The second campaign may ultimately be more valuable, but only if its acquisition cost and contribution economics support that conclusion.
Use comparable time windows and account for campaign targeting, promotions, customer demographics where lawfully collected, and product categories. Cohort differences show associations; they do not automatically prove that the channel caused the difference.
8. What to Look For in Cohort Analysis
Improving Retention Across Newer Cohorts
If newer cohorts return at higher rates during comparable elapsed periods, a change in the customer experience or marketing mix may be helping. Review changes to onboarding, product quality, delivery reliability, loyalty programs, and post-purchase communication.
Retention Drops After the First Purchase
A sharp decline after the acquisition period can indicate that many customers purchase once and do not return quickly. Investigate product repurchase cycles, customer expectations, follow-up communication, and whether your product is naturally a one-time purchase.
High Retention but Low Revenue Growth
Customers may be returning but placing smaller orders or buying lower-margin products. Check order frequency, average order value, discount use, product mix, and contribution margin.
Strong Early Retention Followed by a Decline
Customers might make an initial repeat purchase but fail to develop a lasting habit. Examine replenishment timing, customer support issues, product durability, loyalty incentives, and changes in the competitive landscape.
One Channel Produces Higher-Value Customers
Some sources may bring customers who purchase more often or spend more over time. Validate the difference using comparable cohort ages and profit-oriented metrics before reallocating marketing budgets.
A Sudden Change in Every Cohort
If many cohorts change at once, investigate broader influences such as tracking changes, payment problems, stock shortages, shipping disruptions, pricing updates, or seasonality. A simultaneous shift may not be caused by the latest acquisition campaign.
9. Use Cohort Analysis to Improve Retention Marketing
Once you identify a retention pattern, use it to form a targeted hypothesis. Avoid sending every customer the same promotion simply because a cohort has a lower return rate.
| Observed Pattern | Potential Action | Metric to Monitor |
|---|---|---|
| Customers do not make a second purchase. | Improve post-purchase guidance or send a relevant follow-up. | Repeat purchase rate and contribution per customer. |
| Customers return around predictable intervals. | Test replenishment reminders timed to the product cycle. | Incremental repeat purchases. |
| Discount-acquired customers rarely return. | Test value-based messaging and product education. | Retention and margin without repeated discounts. |
| One product category has stronger retention. | Test relevant cross-sells and complementary products. | Repeat order value and contribution margin. |
| A cohort has lower repeat purchasing after delivery issues. | Investigate fulfillment quality and customer support. | Repeat purchase rate, refunds, and complaints. |
Measure whether the action changes behavior, not merely whether customers open an email or click a link. A randomized holdout group can help estimate incremental impact when it is practical and appropriate.
10. Calculate Cohort Retention and Revenue
Use the calculator below to estimate basic cohort metrics from your own figures. Enter the number of customers in the original cohort, how many made another purchase, and the revenue generated during the selected period.
E-Commerce Cohort Calculator
This calculator uses the original cohort size as the denominator. Enter unique customers who returned during the period—not the total number of orders.
Estimates use the values entered above.
Understanding the Calculator
Period retention is calculated by dividing returning customers by the original cohort size. Customers who did not return in the selected period are the original cohort size minus the number of returning customers.
Revenue per original cohort customer divides the selected period’s revenue by the original cohort size. Average order value divides the selected period’s revenue by the number of orders.
These metrics describe the chosen period only. If you want cumulative revenue per customer, enter cumulative revenue through the end of the desired observation window. If you want repeat purchase rate, ensure the returning customer count includes customers with at least two purchases in total.
11. Common Cohort Analysis Mistakes
Comparing Cohorts with Different Observation Windows
Recent cohorts have less time to return and spend. Compare the same elapsed periods or explicitly account for incomplete observation windows.
Confusing Users, Customers, and Orders
One customer can generate multiple orders and multiple analytics users may not always map cleanly to one customer. Use the correct entity and denominator for each metric.
Ignoring Seasonality
Customers acquired during a major sale or holiday season may behave differently from customers acquired during quieter months. Consider seasonal demand and promotional differences when interpreting results.
Relying Only on Revenue
Revenue does not account for every cost. Discounts, product costs, fulfillment, payment fees, returns, and acquisition costs can materially affect the economic value of a cohort.
Assuming Correlation Means Causation
A cohort may show higher retention after a marketing change, but other factors may explain the difference. Use controlled experiments where feasible before attributing the result to a particular action.
Using Cohorts That Are Too Small
Small groups can produce unstable percentages. Combine periods or broaden segments when necessary, and report cohort size alongside the rate.
12. Cohort Analysis Implementation Checklist
Use this checklist to prepare a reliable cohort analysis and turn the findings into decisions.
Complete each item as you verify it.
Frequently Asked Questions
What is cohort analysis in e-commerce?
Cohort analysis groups customers who share a characteristic, such as the month of their first purchase, and measures their behavior over time. It helps businesses understand retention, repeat purchasing, revenue, and customer value.
How do you calculate customer retention by cohort?
For a simple period retention rate, divide the number of customers from the original cohort who made a qualifying purchase during the selected period by the original cohort size, then multiply by 100. Define the return condition and period consistently.
Can GA4 perform cohort analysis?
GA4 includes cohort exploration features that can analyze groups of users over time based on configured inclusion and return conditions. For detailed order-level retention, first-purchase identification, or profitability analysis, you may also need data from your e-commerce platform or data warehouse.
What is a good e-commerce retention rate?
There is no single ideal rate for every store. Purchase frequency differs significantly between consumables, fashion, electronics, furniture, and other categories. Compare similar customer groups, use consistent observation windows, and establish a baseline for your own business.
How often should an online store run cohort analysis?
Many stores review cohorts monthly, while high-volume businesses may monitor them weekly. The best frequency depends on purchase cycles, sales volume, and how quickly the business can act on the results.
What is the difference between cohort analysis and customer segmentation?
Customer segmentation groups customers by characteristics such as location, spending, or behavior. Cohort analysis focuses on groups that share a starting point or event and tracks their behavior over time. Cohort analysis can also be combined with segmentation.
How does cohort analysis help calculate customer lifetime value?
Cohort revenue and repeat-purchase behavior provide evidence about how customer value accumulates over time. To estimate lifetime value, combine the observed revenue or contribution with an appropriate time horizon and a clearly defined cost model. Avoid treating a short observation period as a complete lifetime estimate.
Conclusion: Make Better E-Commerce Decisions with Cohort Analysis
Cohort analysis helps e-commerce businesses move beyond total sales and understand how customers behave after acquisition. By comparing retention, repeat purchases, revenue, and contribution across groups, you can identify which customers return, which marketing channels deliver lasting value, and where the customer experience may need improvement.
Start with a clear cohort definition, reliable order data, and a small set of useful metrics. Compare equivalent time windows, investigate meaningful differences, and test targeted retention initiatives. With consistent measurement, cohort analysis can support smarter marketing decisions, stronger customer relationships, and more sustainable growth.
Create a first-purchase-month cohort report and compare Month 1 repeat purchase rate and revenue per acquired customer. Once you have a baseline, segment by acquisition channel and investigate the differences that matter most to profitability.
Further reading: Google Analytics Help for GA4 exploration and reporting documentation.